Submitted on
Comments on the Soil Gas Investigations Conducted by SoCalGas Made In Response to the Grassroots Coalition Settlement Agreement
Actual Youtube videos Gas Sampling http://www.youtube.com/watch?v=LR1r9X2VGZo&feature=geosearchand http://www.youtube.com/watch?v=NNA2f3GvUPg&NR=1) show these gas bubbles. An excellent report on this extensive gas leakage from the Syndicate-1 well is discussed in a 12 July 2010 letter report (Geoscience Seep Gas Analysis.pdf) submitted by Lewis Pandolfi.
Southern California Gas conducted a soil gas survey in response to a Settlement Agreement that was reached between SoCalGas and the Grassroots Coalition (GC). The Settlement Agreement can be viewed at http://www.laschools.org/project- status/attach/56.40077/APPENDIXX.pdf). SoCalGas response thus far has been to conduct a phase I soil gas survey between June 10 to 26, 2009, with results, posted on the SoCalGas web site at http://www.socalgas.com/safety/playa-del-rey.shtml. The report http://www.socalgas.com/documents/safety/PDRSoilVaporMonitoringReport.pdfis available and can be viewed on the SoCalGas web site.
In spite of the fact that ETI’s soil gas methodologies were specifically requested withinAppendix A of the Settlement Agreement, they were not followed by URS during the Phase I investigation. Instead of using the ETI methodology, URS followed the California “Advisory for Active Soil Gas Investigations, DTSC and RWQCB, dated January 28, 2003. Although this is the official California methodology, it is not the same as the ETI methodology, and does not obtain the same quality data. The only thingthese two methods have in common is they sampled at a depth of 4’ feet below surfaceand URS used similar sample containers having a volume of 125 ml. A review of the data obtained by URS in this phase I soil gas survey easily demonstrates the deficiencies of the California methodology for measuring the concentrations of light methane through butane hydrocarbons in the natural environment. It is very important to note that the California method is not equivalent to the ETI methodology, which was designed specifically for measuring the concentrations of natural hydrocarbon seepages from subsurface petroleum based sources.
As a stated objective, the Settlement Agreement requires SoCalGas to conduct soil gasmonitoring surveys designed to find and evaluate any possible leakage of SoCaGas’s “storage” and/or “pipeline gas” that might have migrated outside of the boundaries of their approved Playa del Rey (PDR) storage field and to evaluate all of their storage wells for casing leakage of either storage gas and/or and natural gas from any subsurface formation that might be migrating to the surface along any of their well casings, whether active or abandoned.
It is very important to note that this includes the Pico Formation, which is a source of numerous natural gas blowouts. This documentation goes back as far as 1944, when Riegle made a structure map of the shallow Pico Formation and suggested that it might provide a significant source of natural gas. Riegle’s structure map was based on numerous Township wells that blew out and six of the main Playa del Rey gas storage wells (Union Del Rey 10, 13, 14, 15, 18 and 19) that had electric logs that could be usedfor evaluation of the Pico Formation. Although Riegle didn’t include the Syndicate 1 onhis map, it also blew out when drilled in 1930 and flowed over 5 MMcfd, indicating that the Pico source extends eastward under the Playa Vista development properties. ETI’s investigations at Playa Vista in 1999 - 2000 proved that the Pico Formation was also the source of the gas seepage occurring at Playa Vista.
Appendix A of the Settlement Agreement specifically states that the planned soil vaporsurveys should use ETI’s soil gas methodologies and references a Camp Dresser & McKee (CDM) report dated November 9, 2000 entitled “Report of Sampling andAnalysis of Soil Gas for Methane in Tracts 49104-01-, -03, -05, -06 Playa Vista Area Dfor the methodology. ETI’s methodology “Field and Laboratory Procedures for Soil Vapor Sampling“, dated January 5, 2000 was provided by ETI in several reports issuedto CDM and to the Los Angeles Department of Building and Safety (LADBS) during the1999 to 2001 time period when Dr. Victor T. Jones, III from ETI served as the “MethanePeer Reviewer for LADBS. A copy of this document is also available directly from ETI. A review and comparison of the soil gas data obtained by URS with the soil gas data obtained by ETI during the Playa Vista investigations provides a simple way to demonstrate the deficiencies of the California methodology for meeting the objectives stated above. However, before making that comparison, it is important to point out an equally significant error in the SoCalGas/URS work plan.
There is a very important conceptual contradiction between the SoCalGas/URS work plan and the requirements contained within Appendix A of the Settlement Agreement, which states that: “Under the first phase of the investigation, one hundred and fifty (150)soil probes will be advanced to depths of 4.0’ (bg) on a 100’ x 100’ foot grid over allSoCalGas surface fee or leasehold interest lands”. It is not possible to use only 150 soil probe samples to conduct a survey on a 100’ x 100’ grid over all SoCalGassurface fee or leasehold interest lands. A 100’ X 100’ gridded survey would requireseveral thousand samples. Obviously SoCalGas has limited the agreement to 150 samples without any regard for the requirement to collect samples on a 100’ x 100’ grid.With this restriction, using only 150 samples, it is impossible to accomplish the stated objectives, even if the ETI sampling and analysis methodologies had been followed.
A review of soil gas data from ETI’s Playa Vista reports demonstrates that collecting soil gas samples on a grid is of a nearly equal significance to employing the correct sampling methodology and in having adequate analytical detection capability. A copy of ETI’s CD_6.2Playa Vista report released to Mr. Paul Mount, Chief of the Mineral Resources Division of the California Division of Oil and Gas by Mr. Ray Chan, Chief of the Engineering Bureau at LADBS was released to public record and is available on request. This CD contains numerous reports, data tables, maps and figures that are significant to understanding the deficiencies of the URS phase I soil gas monitoring report and the logic contained within Appendix A of the Settlement Agreement.
It is important to understand that gases migrating through the earth do not follow isotropic nor homogeneous pathways, so that making valid soil gas measurements and maps of soil gas anomalies requires the use of gridded surveys containing many samples and very low analytical (ppbv level) detection capability. Below the vadose zone the methodology must include the measurement of both free and dissolved gases in the underlying aquifers. The planned Phase II surveys cannot be completed within this area using multi-depth soil vapor stations because the groundwater is too shallow for collection of vapor samples. Phase II must use the groundwater and/or deeper aquifers to collect and measure the free and dissolved gases in the aquifers. The lateral transmissibility of the underlying aquifers significantly aids the movement of dissolved gases, helping in relating the deeper dissolved gases to the shallow soil gases. Comparison of shallow soil vapors with deeper dissolved gases in the underlying aquifers is completely compatible so long as both are correctly collected and analyzed.
The problem with using the California methodology for measuring natural hydrocarbon seepage is not new. A demonstration of ETI’s methodology was required back in 1999when ETI was first hired to evaluate the potential methane problem at Playa Vista. An example from two soil gas surveys conducted by Camp, Dresser & McKee (CDM) over Tract 03 at Playa Vista on 9/21/1999 and 10/07/1999 using the California Geo-Probe methodology are included for comparison with ETI data that was collected in October –November of 1999, after the first two surveys were completed. As shown by thisCalifornia-versus-ETI-Methodology.pdf poster, the largest methane found by the California method was 970 ppmv at site 07. The second survey conducted 14 days later reported only 55 ppmv when site 07 was resampled. CDM suggested that their data showed there were no appreciable concentrations of methane gas present in the shallow soil gas in this area, and that they had reduced the methane concentration within the soil vapor even further by purging their sampling tools in following the California sampling procedures.
In contrast, the ETI survey conducted after the two California method attempts found methane concentrations that ranged upwards of 59 to 73% (590,400 to 732,000 ppmv). These ETI sites also contained approximately 3000 ppmv of ethane, 30 ppmv of propane, less than 10 ppmv of iso-butane and less than 1 ppmmv of normal-butane. Although these C2+ gases are not large, they are indicative of non-biogenic sources. A comparison with the CDM gases, as shown below, is striking. Site 07 has no ethane or propane, but does have small concentrations of butane, pentane and C6+ (0.049, 0.773, 0.7 ppmv) and even 4 ppmv of C6+ hexanes.
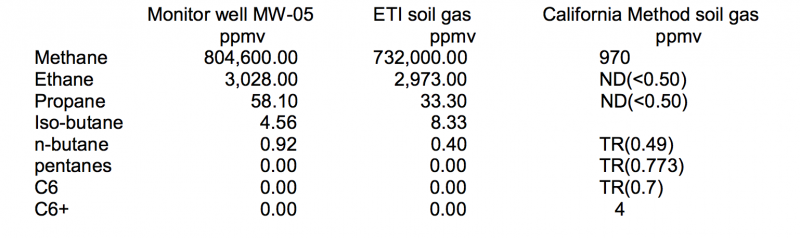
Monitor well MW-5A (see the Tract 03 report discussed below), which is fairly close to site 07 contains 80.46% methane with 3028 ppmv ethane, 58.1 ppmv propane, 4.56 ppmv iso-butane, 0.92 normal-butane and no C6+ components. Clearly the California method soil gas data is very different from the underlying gases in the aquifer, having very small methane, a complete lack of ethane and propane and measureable butanes and other C6 hydrocarbon gases. This signature suggests the methane is diluted with atmospheric air, and the heavier components are likely contamination from the Geoprobe drill rig tools. The butanes and heavier components could not have come from the aquifer source, so contamination from the drilling tools, coupled with dilution of the soil gas is the only logical explanation.
The objective for conducting these soil gas surveys was to delineate the distribution of the gases contained with the fifty foot deep gravel aquifer that is the underlying source for the soil gas anomalies. Documentation for meeting these objectives is contained in an early report given to Mr. David Hsu, Chief of the Grading Section at LADBS on November 29, 1999. This report, entitled Tract 03 Report confirms that the ETI soil gas method compositionally matches the aquifer gases, whereas the California method does not. Plate 1 and Plate 2 from the Tract 03 report provides maps of the deeper aquifer and surface soil gases, showing the coherence between these two independentdata sets. The Tract 03 report demonstrates ETI’s methodology for mapping migratingnatural gases within all environments, from the surface, down into the underlying aquifers. As illustrated by this report, conducting such investigations correctly, and validating the results requires the measurement of gases in the atmosphere, the near- surface vadose zone and in deeper formations using water wells, and eventually, even to the oil and gas production wells.
ETI’s soil gas data also shows the complex distribution of methane anomalies that canonly be correctly delineated by sampling on a grid. The Tract 03 report provides a graphical and easily understandable example of the correct approach and methodology used by ETI in the Playa Vista investigations. This approach, which employs both vadose zone soil gases with deeper dissolved gases in the underlying aquifers defines the approach that must be followed in order to conduct meaningful phase I and IIsurveys. Phase I must be conducted on a grid using ETI’s sampling and analysis methodology, with sub-ppmv analysis capability. Due to shallow groundwater in this area, phase II must be conducted using dissolved gas analysis made on groundwater samples obtained from monitor wells that have been placed using soil gas maps from phase I for guidance.
ETI’s Playa Vista soil gas data and reports provide the best available guidance for evaluating the 2009 URS phase I soil gas data. In addition to the Tract 03 report, it would be also useful to view Plate 2-RegionalReport and Plate 3-RegionalReport fromETI’s “Regional Geochemical Assessment of Methane, BTEX, CO2 and H2S GasOccurrences” report submitted on July 10, 2001 to the Mineral Resources Division of the California Division of Oil and Gas. Plates 2 and 3 from this regional report contain methane and ethane soil gas data from the entire area of investigation, including some overlap with the Playa Del Rey field where the more recent 2009 URS phase I report was conducted.
An examination of the URS data tables shows that no ambient (2.5 ppmv), nor sub- ambient methane concentrations were reported in the 2009 URS phase I report. In sharp contrast, the ETI data on the regional Playa Vista methane soil gas map (Plate 2)shows that background methane concentrations are often less than the atmospheric concentration of approximately 2.0 ppmv. All the URS sites have very large methane values, generally ranging from over 15 to 30 ppm, or greater. Such large methane values would mean that all of the sites are impacted by migrated methane, or that the URS methane concentrations are bottom truncated, since they are well above the typical background concentration of shallow soil gas methane. A comparison with Plate 2 from the regional ETI Playa Vista report clearly shows that the area where the URS survey was conducted contains a large number of soil gas sites where methane is at, or below the ambient methane concentration of approximately 2.0 ppm. The very large methane values in the URS report (generally greater than 15 ppmv) suggests that every one of the URS samples have been impacted by methane that could only have come from depth. The concentration of methane in the atmospheric is less than 2 ppmv, so 15 plus ppmv methane anomalies cannot be derived from the atmosphere. These anomalously large methane concentrations in the URS soil gas data suggests migration seepage from depth occurs at nearly every site. That is either true, or their methane data is invalid.
Even more problems with the URS data are obvious when one looks at their ethane and propane data. Detection limits for ethane and propane of 3 and 1.5 ppmv are much too large for mapping the normal range of natural ethane and propane soil gas anomalies. The ethane data on Plate 3 from the regional ETI Playa Vista report provides an example of the expected range for ethane, which is in the sub-ppmv concentrations in this area where the URS samples were collected. Ethane and propane are very significant to the interpretation of deep sourced gases and must be correctly detected and measured in order to meet the stated objectives of detecting deep sourced, petroleum related storage gases. A comparison of the URS data with the ETI soil gas anomalies from Plate 3 shows that ethane background concentrations are nearly always less than 0.100 ppm in the area where the URS data was collected. The larger ethane magnitudes are found only near macro seeps, which generally have a fairly small aerial footprint, where magnitudes increase rapidly from background levels to percent concentrations where the very largest concentrations are found.
This lack of adequate sensitivity is further compounded by URS using two different purge volumes for their Geoprobe samples. Sites 1 to 63 had one purge volume of 365 ml removed, while sites 64 to 150 had three purge volumes of 1095 ml removed before collecting the vapor sample. This increase from one to three purge volumes for the last 86 samples dilutes the final 86 samples with respect to the first 64 samples, further decreasing the concentrations for the smaller magnitude ethane through butanes to values that are obviously below the URS labs detection limits.
The objective for conducting soil gas surveys is to measure the naturally occurring equilibrium established between the soil gas vapors and the subsurface contamination. This equilibrium is in delicate balance (particularly in low-permeability clays) or wet sediments and is easily disturbed. Only the vapor in the sampling tools should be purged. The result in this case is that no background level methane or ethane plushydrocarbons were found in any sample. A review of ETI’s Plates 2 and 3 from theregional Playa Vista report shows the background concentrations that should have been found in, at least a few of the 2009 URS soil gas samples. Clearly, the URS analytical detection limits are far too large for measuring any of the methane, ethane, propane or butanes in the natural environment.
The only useful data obtained by the 2009 URS soil gas survey were the macro level hits at sites 64 near the Del Rey 10 well and sites 137 to 142 near the Stewart, Covington and Riegle production wells. Del Rey 10 has had documented macro level leakage on the pad around the well site for more than 30 years, however, the macro level seepage around the Stewart, Covington and Riegle production wells has not been previously reported and should be a serious concern for SoCalGas. It is interesting to note that URS recommended that this new leakage be further investigated, yet SoCalGas deleted that recommendation from the first draft of the URS report. The need to further investigate this new macro seepage was confirmed nearly two years later on Feb. 24, 2011, when water and storage gas was found to be flowing from the surface casing annulus of the Riegle 1 well, causing SoCalGas to be cited by DOGGER (Formal Order no. 1008). Pressure was reported to be building up in several wells in the vicinity of Riegle 1. No macro level leakage should ever be tolerated without an investigation of the cause.
With the exception of finding two macro seeps, the URS data and report are inadequate and do not meet the minimum Phase I requirements, to say nothing about the fact thatthe main premise of using a 100’ X 100’ grid have not been followed or even addressed.As stated in the 2009 URS phase I report, two probes were planned for each gas storage well, and less than two whenever the production wells were close together. This planned URS sample spacing is totally inadequate for finding or defining any seepage found, and obviously is inadequate or determining the size and/or shape of typical soil gas anomalies, on either a regional basis, or particularly around a deep production well where much closer spacing is required.
An example of the seepage associated with an abandoned dry hole, the Syndicate #1,can be viewed on ETI’s Plates 2 and 3, on the regional Playa Vista soil gas maps. Thisabandoned well lies south of Jefferson and west of Lincoln Avenue. Expanded scale illustrations of methane and ethane posted in ppmv have been generated and are included Syndicate-1-well to provide a more detailed view of the seeps located near this well. ETI’s soil gas site location numbers are also posted above the site symbol (cross) on the ethane map, and ethane is posted below the symbol. Note that only five samples are above the 10 ppmv methane contour interval, and only 8 samples are above the 0.5 ppmv ethane contour interval. The majority of the soil gas samples, even right next to the well are much lower in concentration, and even more importantly, the ETI investigators did not observe any macro level seepage (i.e. bubbles) back in 2000 when the Playa Vista surveys were done. This data shows that one soil gas sample placed at random near a well is totally inadequate for determining whether that well is associated with any leakage from depth.
It is particularly significant to note that this response is associated with an abandoned dry hole that is not a gas storage well, and has never produced oil or gas. The ETI data discussed above was collected in 2001 before the well was re-abandoned by Playa Vista. Following re-abandonment the leakage around this well has significantly increased and today is reported by DOGGER to be vigorously bubbling around the casing and includes additional vents more than 100 feet away from the casing. Actual Youtube videos http://www.youtube.com/watch?v=LR1r9X2VGZo&feature=geosearchand http://www.youtube.com/watch?v=NNA2f3GvUPg&NR=1) show these gas bubbles. An excellent report on this extensive gas leakage from the Syndicate-1 well is discussed in a 12 July 2010 letter report (Geoscience Seep Gas Analysis.pdf) submitted by Lewis Pandolfi.
A similar response to this could be found around any well in the general Playa del Rey area, regardless of whether it is, or was a gas storage well, or an abandoned oil and gas well. All old well casings are potential leakage conduits and all of the known wells, whether abandoned or not, should have been included in the planned phase I soil gas survey. This increase in leakage activity is obviously related to the re- abandonment of the well. It can never be assumed that a re-abandonment of any well will always be successful. Follow-up soil gas surveys are the only way to prove that the re-abandonment was successful.
The number of soil gas samples has to be set by the grid requirements and cannot be arbitrarily set to only 150 total samples. In addition, the analytical laboratory has to have sub-ambient level methane (1 to 2 ppmv) and ppbv level C2+ detection capability. A valid soil vapor survey often requires additional infill samples placed on an evencloser 30’ to 50’ spacing to validate results. This was done on several subareas at Playa Vista. The problems with the URS data become obvious when compared to the regional ETI soil gas data from the main Playa Vista report that contains actual soil gas data collected by ETI from the same area as the URS report.
In addition, as noted earlier, Phase II cannot be completed using multi-depth soil vapor stations within this particular area because groundwater will be too shallow over most of the area for the collection of soil gas from deeper soil gas probes. Phase II must include the use of dissolved and/or free gases derived from monitor wells that have been installed using the soil gas anomalies as a guide for placement. ETI’s Playa Vista investigations provide examples for using this approach, where groundwater samples collected from monitor wells were used to determine the migrated hydrocarbon gases in the subsurface aquifers that are the source of the shallower soil vapor anomalies. The Phase II scope of work should also include the use of stable hydrocarbon isotopes and the measurement of helium on all samples.
Gas samples should also be collected directly from the surface casing, intermediate annulus casing and tubing at all production related wells. All wells should be included in any evaluation, regardless of whether they are producing or abandoned, including even dry holes such as the Syndicate 1, which is now become a problem well that would be very dangerous if located near any buildings. The Troxel-1, Del Rey 10 and several of the other Township wells are as likely to be vertical leakage conduits as the Syndicate- 1. They could be leaking as much as the Syndicate-1, but are not obvious because they are not covered by water, which allows the bubbles to be observed. In such cases, only a soil gas survey can determine whether gas leakage is occurring.
Sincerely,
Exploration Technologies, Inc. Environmental Division
Victor T. Jones, Ph.D.
- 4441 reads